Matthew Brehmer, HCI and information visualization researcher

Matt Brehmer (he/him) is a human-computer interaction (HCI) and data visualization researcher interested in ubietous information experiences: he designs, implements, and evaluates new ways to communicate and collaborate around data.

–––

As of Fall 2024, Matt is an Assistant Professor in the David. R. Cheriton School of Computer Science and a member of the CS HCI Lab at the University of Waterloo 🇨🇦. Book time with him or contact him at mbrehmer [at] uwaterloo.ca. If you are a student interested in working with him, please follow these instructions.

–––

linkedin | github | vis.social | bsky | substack

selected projects


Tableau for visionOS

Seeing and understanding data in the medium of spatial computing.

tableau youtube channel | tableau.com blog | available on visionos testflight

Tableau Gestures

Augmented webcam video presentations with interactive visualization overlays.

video | tableau.com blog

Diatoms

A technique for generating design inspiration for data visualization, demonstrated as a Dashboard Extension for Tableau.

video

The Information in Our Hands

Webcam-based pose recognition for controlling dynamic data visualization.

video

Interactive and Dynamic Visualization on Mobile Phones

Demonstrations of gesture-based interaction with dynamic data visualization on mobile phones, as well as responsive trend and range visualization.

tilt + dial interaction github repo | tilt + dial video | trend vis github repo | range vis github repo

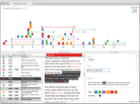
Microsoft Timeline Storyteller

An expressive visual storytelling environment for presenting timelines in the browser or in Power BI.

power bi custom visual | github repo | video gallery | data insights summit keynote demo


publications

also available via google scholar


VisConductor: Affect-Varying Widgets for Animated Data Storytelling in Gesture-Aware Augmented Video Presentation

Temiloluwa (Paul) Femi-Gege, Matthew Brehmer, and Jian Zhao.
In Proceedings of the ACM on Human-Computer Interaction (PACM), Interactive Surfaces and Spaces (ISS) 2024.

conference paper (preprint) | | acm library (open access) supplemental video

The Data-Wink Ratio: Emoji Encoder for Generating Semantically-Resonant Unit Charts

Matthew Brehmer, Vidya Setlur, Zoe, and Michael Correll.
In Proceedings of the IEEE VIS 2024 Workshop on Data Storytelling in an Era of Generative AI (Gen4DS).

workshop paper (preprint) | supplemental video

TimeSplines: Sketch-based Authoring of Flexible and Idiosyncratic Timelines

Anna Offenwanger, Matthew Brehmer, Fanny Chevalier, and Theophanis Tsandilas.
In IEEE Transactions on Visualization and Computer Graphics (IEEE VIS 2023).
Best Paper Award

journal paper (preprint) | supplemental video | timesplines web app

Visualizing the Weird and the Eerie

Matthew Brehmer.
In proceedings of the alt.VIS workshop at IEEE VIS 2023.

workshop paper (arxiv preprint)

Combining Voice and Gesture for Presenting Data to Remote Audiences

Arjun Srinivasan and Matthew Brehmer.
In proceedings of the MERCADO workshop at IEEE VIS 2023.

workshop paper (preprint)

Inspiration at the Roll of the Dice: An Exercise in Aleatoric Visualization Design

Matthew Brehmer.
In Nightingale Issue #2 (Winter 2022): "Inspiration".

order magazine

Augmented Chironomia for Presenting Data to Remote Audiences

Brian D. Hall, Lyn Bartram, and Matthew Brehmer.
In proceedings of the 2022 ACM Symposium on User Interface Software and Technology (UIST).
Best Paper Honorable Mention Award

conference paper (arxiv preprint) | acm library (open access) | supplemental video

Generative Design Inspiration for Glyphs with Diatoms

Matthew Brehmer, Robert Kosara, and Carmen Hull.
IEEE Transactions on Visualization and Computer Graphics (IEEE VIS 2021).

journal paper (arxiv preprint) | ieee library (open access) | supplemental video

Interacting with Visualization on Mobile Devices

Matthew Brehmer, Bongshin Lee, John Stasko, and Christian Tominski.
A chapter in Mobile Data Visualization, edited by Bongshin Lee, Raimund Dachselt, Petra Isenberg, Eun Kyoung Choe, 2021.

order book | dagstuhl seminar report

Responsive Visualization Design for Mobile Devices

Tom Horak, Wolfgang Aigner, Matthew Brehmer, Alark Joshi, and Christian Tominski.
A chapter in Mobile Data Visualization, edited by Bongshin Lee, Raimund Dachselt, Petra Isenberg, Eun Kyoung Choe, 2021.

order book | dagstuhl seminar report

QualDash: Adaptable Generation of Visualisation Dashboards for Healthcare Quality Improvement

Mai Elshehaly, Rebecca Randell, Matthew Brehmer, Lynn McVey, Natasha Alvarado, Chris P. Gale, and Roy A. Ruddle.
In Volume 27, Issue 2 (Feb. 2021) of IEEE Transactions on Visualization and Computer Graphics (IEEE VIS 2020).

journal paper (arxiv preprint) | ieee library

Orchard: Exploring Multivariate Heterogeneous Networks on Mobile Phones

Philipp Eichmann, Darren Edge, Nathan Evans, Bongshin Lee, Matthew Brehmer, and Christopher White.
In Computer Graphics Forum / Proceedings of the Eurographics Conference on Visualization (EuroVis 2020).

conference paper (preprint) | video | eurographics library

Inking Your Insights: Investigating Digital Externalization Behaviors During Data Analysis

Yea-Seul Kim, Nathalie Henry Riche, Bongshin Lee, Matthew Brehmer, Michel Pahud, Ken Hinckley, and Jessica Hullman.
In Proceedings of the ACM International Conference on Interactive Surfaces and Spaces (ISS 2019).

conference paper (preprint) | acm library

A Comparative Evaluation of Animation and Small Multiples for Trend Visualization on Mobile Phones

Matthew Brehmer, Bongshin Lee, Petra Isenberg, and Eun Kyoung Choe.
In Volume 26, Issue 1 (Jan. 2020) of IEEE Transactions on Visualization and Computer Graphics (IEEE VIS 2019).

journal paper (arxiv preprint) | ieee library

Critical Reflections on Visualization Authoring Systems

Arvind Satyanarayan, Bongshin Lee, Donghao Ren, Jeffrey Heer, John Stasko, John R. Thompson, Matthew Brehmer, and Zhicheng Liu.
In Volume 26, Issue 1 (Jan. 2020) of IEEE Transactions on Visualization and Computer Graphics (IEEE VIS 2019).

journal paper (arxiv preprint) | ieee library | vis-tools-reflections.github.io

Thumbnails for Data Stories: A Survey of Current Practices

Hwiyeon Kim, Juyoung Oh, Yunha Han, Sungahn Ko, Matthew Brehmer, and Bum Chul Kwon.
In the Short Paper Proceedings of IEEE VIS 2019.

short paper (arxiv preprint)

DataToon: Drawing Dynamic Network Comics With Pen + Touch Interaction

Nam Wook Kim, Nathalie Henry Riche, Benjamin Bach, Guanpeng A. Xu, Matthew Brehmer, Ken Hinckley, Michel Pahud, Haijun Xia, Michael McGuffin, and Hanspeter Pfister.
In proceedings of the 2019 ACM Conference on Human Factors in Computing Systems (CHI 2019).

conference paper (preprint) | acm library

Timeline Storyteller: The Design & Deployment of an Interactive Authoring Tool for Expressive Timeline Narratives

Matthew Brehmer, Bongshin Lee, Nathalie Henry Riche, David Tittsworth, Kate Lytvynets, Darren Edge, and Christopher White.
In Proceedings of the 2019 Computation + Journalism Symposium (C+J 2019).

symposium paper (preprint)

Visualizing Ranges over Time on Mobile Phones: A Task-Based Crowdsourced Evaluation

Matthew Brehmer, Bongshin Lee, Petra Isenberg, and Eun Kyoung Choe.
In Volume 25, Issue 1 (Jan. 2019) of IEEE Transactions on Visualization and Computer Graphics (IEEE VIS 2018).

journal paper (preprint) | ieee library

Charticulator: Interactive Construction of Bespoke Chart Layouts

Donghao Ren, Bongshin Lee, and Matthew Brehmer.
In Volume 25, Issue 1 (Jan. 2019) of IEEE Transactions on Visualization and Computer Graphics (IEEE VIS 2018).
Best Paper Honorable Mention Award

journal paper (preprint) | ieee library | charticulator.com

Reflecting on the Evaluation of Visualization Authoring Systems

Donghao Ren, Bongshin Lee, Matthew Brehmer, and Nathalie Henry Riche.
In the workshop proceedings of BELIV 2018: Evaluation and Beyond - Methodological Approaches for Visualization.

preprint

What's the Difference?: Evaluating Variants of Multi-Series Bar Charts for Visual Comparison Tasks

Arjun Srinivasan, Matthew Brehmer, Bongshin Lee, and Steven Drucker.
In the proceedings of the 2018 ACM Conference on Human Factors in Computing Systems (CHI 2018).

conference paper (preprint) | acm library

Data Visualization on Mobile Devices (Workshop)

Bongshin Lee, Matthew Brehmer, Eun Kyoung Choe, Petra Isenberg, Ricardo Langer, and Raimund Dachselt.
In the extended abstract proceedings of the 2018 ACM Conference on Human Factors in Computing Systems (CHI 2018).

extended abstract (preprint) | acm library | mobilevis.github.io

Evaluating Data-Driven Stories & Storytelling Tools

Fereshteh Amini *, Matthew Brehmer *, Gordon Bolduan, Christina Elmer, and Benjamin Wiederkehr ( * equal contribution ).
A chapter in Data-Driven Storytelling, edited by Nathalie Henry Riche, Christophe Hurter, Nicholas Diakopoulos, and Sheelagh Carpendale, 2018.

order book | dagstuhl seminar report

Demonstrating the Value of Visualization: Highlights from the 2017 PacificVis Visual Data Storytelling Contest

Matthew Brehmer, Kyungwon Lee, Ivan Viola, Jinwook Seo, and Bongshin Lee.
Poster at IEEE VIS 2017.

poster | abstract | video preview

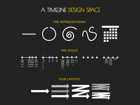
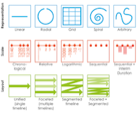
Timelines Revisited: A Design Space and Considerations for Expressive Storytelling

Matthew Brehmer, Bongshin Lee, Benjamin Bach, Nathalie Henry Riche, and Tamara Munzner.
In Volume 23, Issue 9 (Sept. 2017) of IEEE Transactions on Visualization and Computer Graphics.

journal paper | ieee library | timelinesrevisited.github.io

ChartAccent: Annotation for Data-Driven Storytelling

Donghao Ren, Matthew Brehmer, Bongshin Lee, Tobias Höllerer, and Eun Kyoung Choe.
In proceedings of the 2017 IEEE PacificVis Symposium.

conference paper | ieee library | chartaccent.github.io

Why Visualization? Task Abstraction for Analysis and Design

Matthew Brehmer.
University of British Columbia PhD Dissertation (April, 2016).

dissertation (ubc library)

Matches, Mismatches, and Methods: Multiple-View Workflows for Energy Portfolio Analysis

Matthew Brehmer, Jocelyn Ng, Kevin Tate, and Tamara Munzner.
In Volume 22, Issue 1 (Jan. 2016) of IEEE Transactions on Visualization and Computer Graphics (IEEE VIS 2015).

journal paper | ieee library

TimeLineCurator: Interactive Authoring of Visual Timelines from Unstructured Text

Johanna Fulda, Matthew Brehmer, and Tamara Munzner.
In Volume 22, Issue 1 (Jan. 2016) of IEEE Transactions on Visualization and Computer Graphics (IEEE VIS 2015).

journal paper | video | ieee library | timelinecurator.org

C-TOC (Cognitive Testing on Computer): Investigating the Usability and Validity of a Novel Self-administered Cognitive Assessment Tool in Aging and Early Dementia

Claudia Jacova, Joanna McGrenere, Hyunsoo S. Lee, William Wang, Sarah Le Huray, Emily F. Corenblith, Matthew Brehmer, Charlotte Tang, Sherri Hayden, B. Lynn Beattie, and Ging-Yuek R. Hsiung.
In Volume 29, Issue 3 (July 2015) of Alzheimer Disease and Associated Disorders.

journal paper

Overview: The Design, Adoption, and Analysis of a Visual Document Mining Tool For Investigative Journalists

Matthew Brehmer, Stephen Ingram, Jonathan Stray, and Tamara Munzner.
In Volume 20, Issue 12 (Dec. 2014) of IEEE Transactions on Visualization and Computer Graphics (IEEE VIS 2014).

journal paper | ieee library

Visualizing Dimensionally-Reduced Data: Interviews with Analysts and a Characterization of Task Sequences

Matthew Brehmer, Michael Sedlmair, Stephen Ingram, and Tamara Munzner.
In proceedings of the 2014 ACM BELIV Workshop (Beyond Time and Errors: Novel Evaluation Methods for Visualization).

workshop paper | acm library

Pre-Design Empiricism for Information Visualization: Scenarios, Methods, and Challenges

Matthew Brehmer, Sheelagh Carpendale, Bongshin Lee, and Melanie Tory.
In proceedings of the 2014 ACM BELIV Workshop (Beyond Time and Errors: Novel Evaluation Methods for Visualization).

workshop paper | acm library

A Multi-Level Typology of Abstract Visualization Tasks

Matthew Brehmer and Tamara Munzner.
In Volume 19, Issue 12 (Dec. 2013) of IEEE Transactions on Visualization and Computer Graphics (IEEE VIS 2013).
Recipient of the IEEE VIS Test of Time Award (2023)

journal paper | ieee library

Dimensionality Reduction in the Wild: Gaps and Guidance

Michael Sedlmair, Matthew Brehmer, Stephen Ingram, and Tamara Munzner.
University of British Columbia Technical Report TR-2012-03 (2012).

technical report

Investigating Interruptions in the Context of Computerised Cognitive Testing for Older Adults

Matthew Brehmer, Joanna McGrenere, Charlotte Tang, and Claudia Jacova.
In proceedings of the 2012 ACM Conference on Human Factors in Computing Systems (CHI 2012).

conference paper | acm library

A Tale of Two Studies: Investigating the Impact of Interruptions on Task Performance in Older Adults

Matthew Brehmer, Charlotte Tang, Joanna McGrenere, and Claudia Jacova.
In the work-in-progress proceedings of the the 2011 GRAND NCE AGM.

work-in-progress paper

The Haptic Crayola Effect: Exploring the Role of Naming in Learning Haptic Stimuli

Inwook Hwang, Karon MacLean, Matthew Brehmer, Jeff Hendy, Andreas Sotirkopoulos, and Seungmoon Choi.
In proceedings of the 2011 IEEE World Haptics Conference.

conference paper | ieee library

Activate Your GAIM: A Toolkit for Input in Active Games

Matthew Brehmer, T.C. Nicholas Graham, and Tadeusz Stach.
In proceedings of the 2010 ACM Future Play Conference.

conference paper | acm library | developer guide

Classifying Input for Active Games

Tadeusz Stach, T.C. Nicholas Graham, Matthew Brehmer, and Andreas Hollatz.
In proceedings of the 2009 ACM Advances in Computer Entertainment Technology (ACE) Conference.

conference paper | acm library


blogging

new posts at ubix.substack.com


Highlights from IEEE VIS 2021

Nightingale. Noëlle Rakotondravony, Matthew Brehmer, & Yiren Ding.
November 18, 2021

nightingaledvs.com

Highlights from IEEE VIS 2020

Nightingale. Matthew Brehmer & Noëlle Rakotondravony.
November 12, 2020

medium.com/nightingale/

EYEO Festival: Some Impressions By the Data Visualization Society

Nightingale. Jason Forrest, Matthew Brehmer, Amy Cesal, Anthony Starks, and Mollie Pettit.
June 18, 2019

medium.com/nightingale

Timelines, Revisited

10QViz.
June 14, 2019

10qviz.org

Forecasting Domestic Migration Using Search Queries

Part of the (retired) Microsoft Research Interactive Science series of interactive companions to recent research articles.

Summer 2019

github repo | interactive article

Visualizing the Weird and the Eerie

alt.VIS @ IEEE VIS (Melbourne, Australia)
October 23, 2023

video

Stand Behind Your Data!

Outlier Conference (Porto, PT / virtual)
May 4, 2023

video

New Multimodal Experiences for Communicating with an Audience about Data

University of Utah Scientific Computing and Imaging Institute (SCII) Visualization Seminar (Salt Lake City, USA)
October 5, 2022

slides

New Experiences for Communicating with an Audience About Data

Maryland Institute College of Art (MICA) Data Analytics and Visualization MPS Program (Baltimore, USA)
October 3, 2022

slides

Visualization in Context

Data Visualization Society Fireside Chat (virtual), with Keke Wu and Frank Elavsky, moderated by Amanda Makulec
January 24, 2022

video

Generative Design Inspiration for Glyphs with Diatoms

IEEE VIS 2021 (virtual)
October 29, 2021

video

Writing About Visualization

VisInPractice @ IEEE VIS 2021 (virtual) panel with Mary Aviles, Tiziana Alocci, Piero Zagami, Christian Miles, and Danielle Szafir
October 25, 2021

video

The Information in Our Hands

Information+ Conference 2021 (virtual)
September 30, 2021

video

Visualization Consulting & Freelancing

VisInPractice @ IEEE VIS 2020 (virtual) panel with Jane Zhang, Kristin Henry, and Curran Kelleher
October 26, 2020

video

See and Understand Networks

Tableau Conference 2019, with Scott Sherman (Las Vegas, USA)
November 13, 2019

video

Expressive Visualization Tools for Data-Driven Storytelling

ASA Symposium on Data Science and Statistics (SDSS) (Bellevue, USA)
May 30, 2019

slides

Constraints and Opportunities for Expressive Information Design

Tableau Research (Seattle, USA)
April 9, 2019

slides

Constraints and Opportunities for Expressive Information Design

Uncharted Software (Toronto, Canada)
March 1, 2019

slides

Considerations for Interactive & Expressive Information Design Tools

University of Ontario Institute of Technology (Oshawa, Canada)
February 27, 2019

slides

Considerations for Interactive & Expressive Information Design Tools

Autodesk Research (Toronto, Canada)
February 26, 2019

slides

Constraints and Opportunities for Expressive Information Design

Simon Fraser University School of Interactive Arts & Technology (Surrey, Canada)
January 28, 2019

slides

Visualizing Ranges over Time on Mobile Phones

IEEE VIS (InfoVis) 2018 (Berlin, Germany)
October 24, 2018

video | slides

Tools for Expressive Information Visualization Design

Microsoft Vancouver Data Visualization Symposium (Vancouver, Canada)
August 1, 2018

slides

Introducing Timeline Storyteller and ChartAccent for Power BI

UBC School of Journalism Course on Special Topics in Contemporary Journalism: Data Viz (JRNL 520H) (Vancouver, Canada)
October 24, 2017

slides

Timelines Revisited: Considerations for Expressive Storytelling

Radcliffe Institute at Harvard University (Cambridge, USA)
December 8, 2016

slides

Why Visualization? Task Abstraction for Analysis and Design

Dissertation Defence (Vancouver, Canada)
March 23, 2016

slides

Why Visualization? Task Abstraction for Analysis and Design

Microsoft Research (Redmond, USA)
February 1, 2016

video | slides

The Future of Data and Design … In Visualization Research

Vancouver Data Visualization Meetup (Vancouver, Canada)
May 19, 2015

slides | keynote

Visualization Task Abstraction from Multiple Perspectives

IEEE VIS Doctoral Colloquium 2014 (Paris, France)
November 8, 2014

abstract | poster | slides | keynote | video preview

A Multi-Level Typology of Abstract Visualization Tasks

IEEE VIS (InfoVis) 2013 (Atlanta, USA)
October 15, 2013

video | video preview | slides | keynote